INTRODUCTION
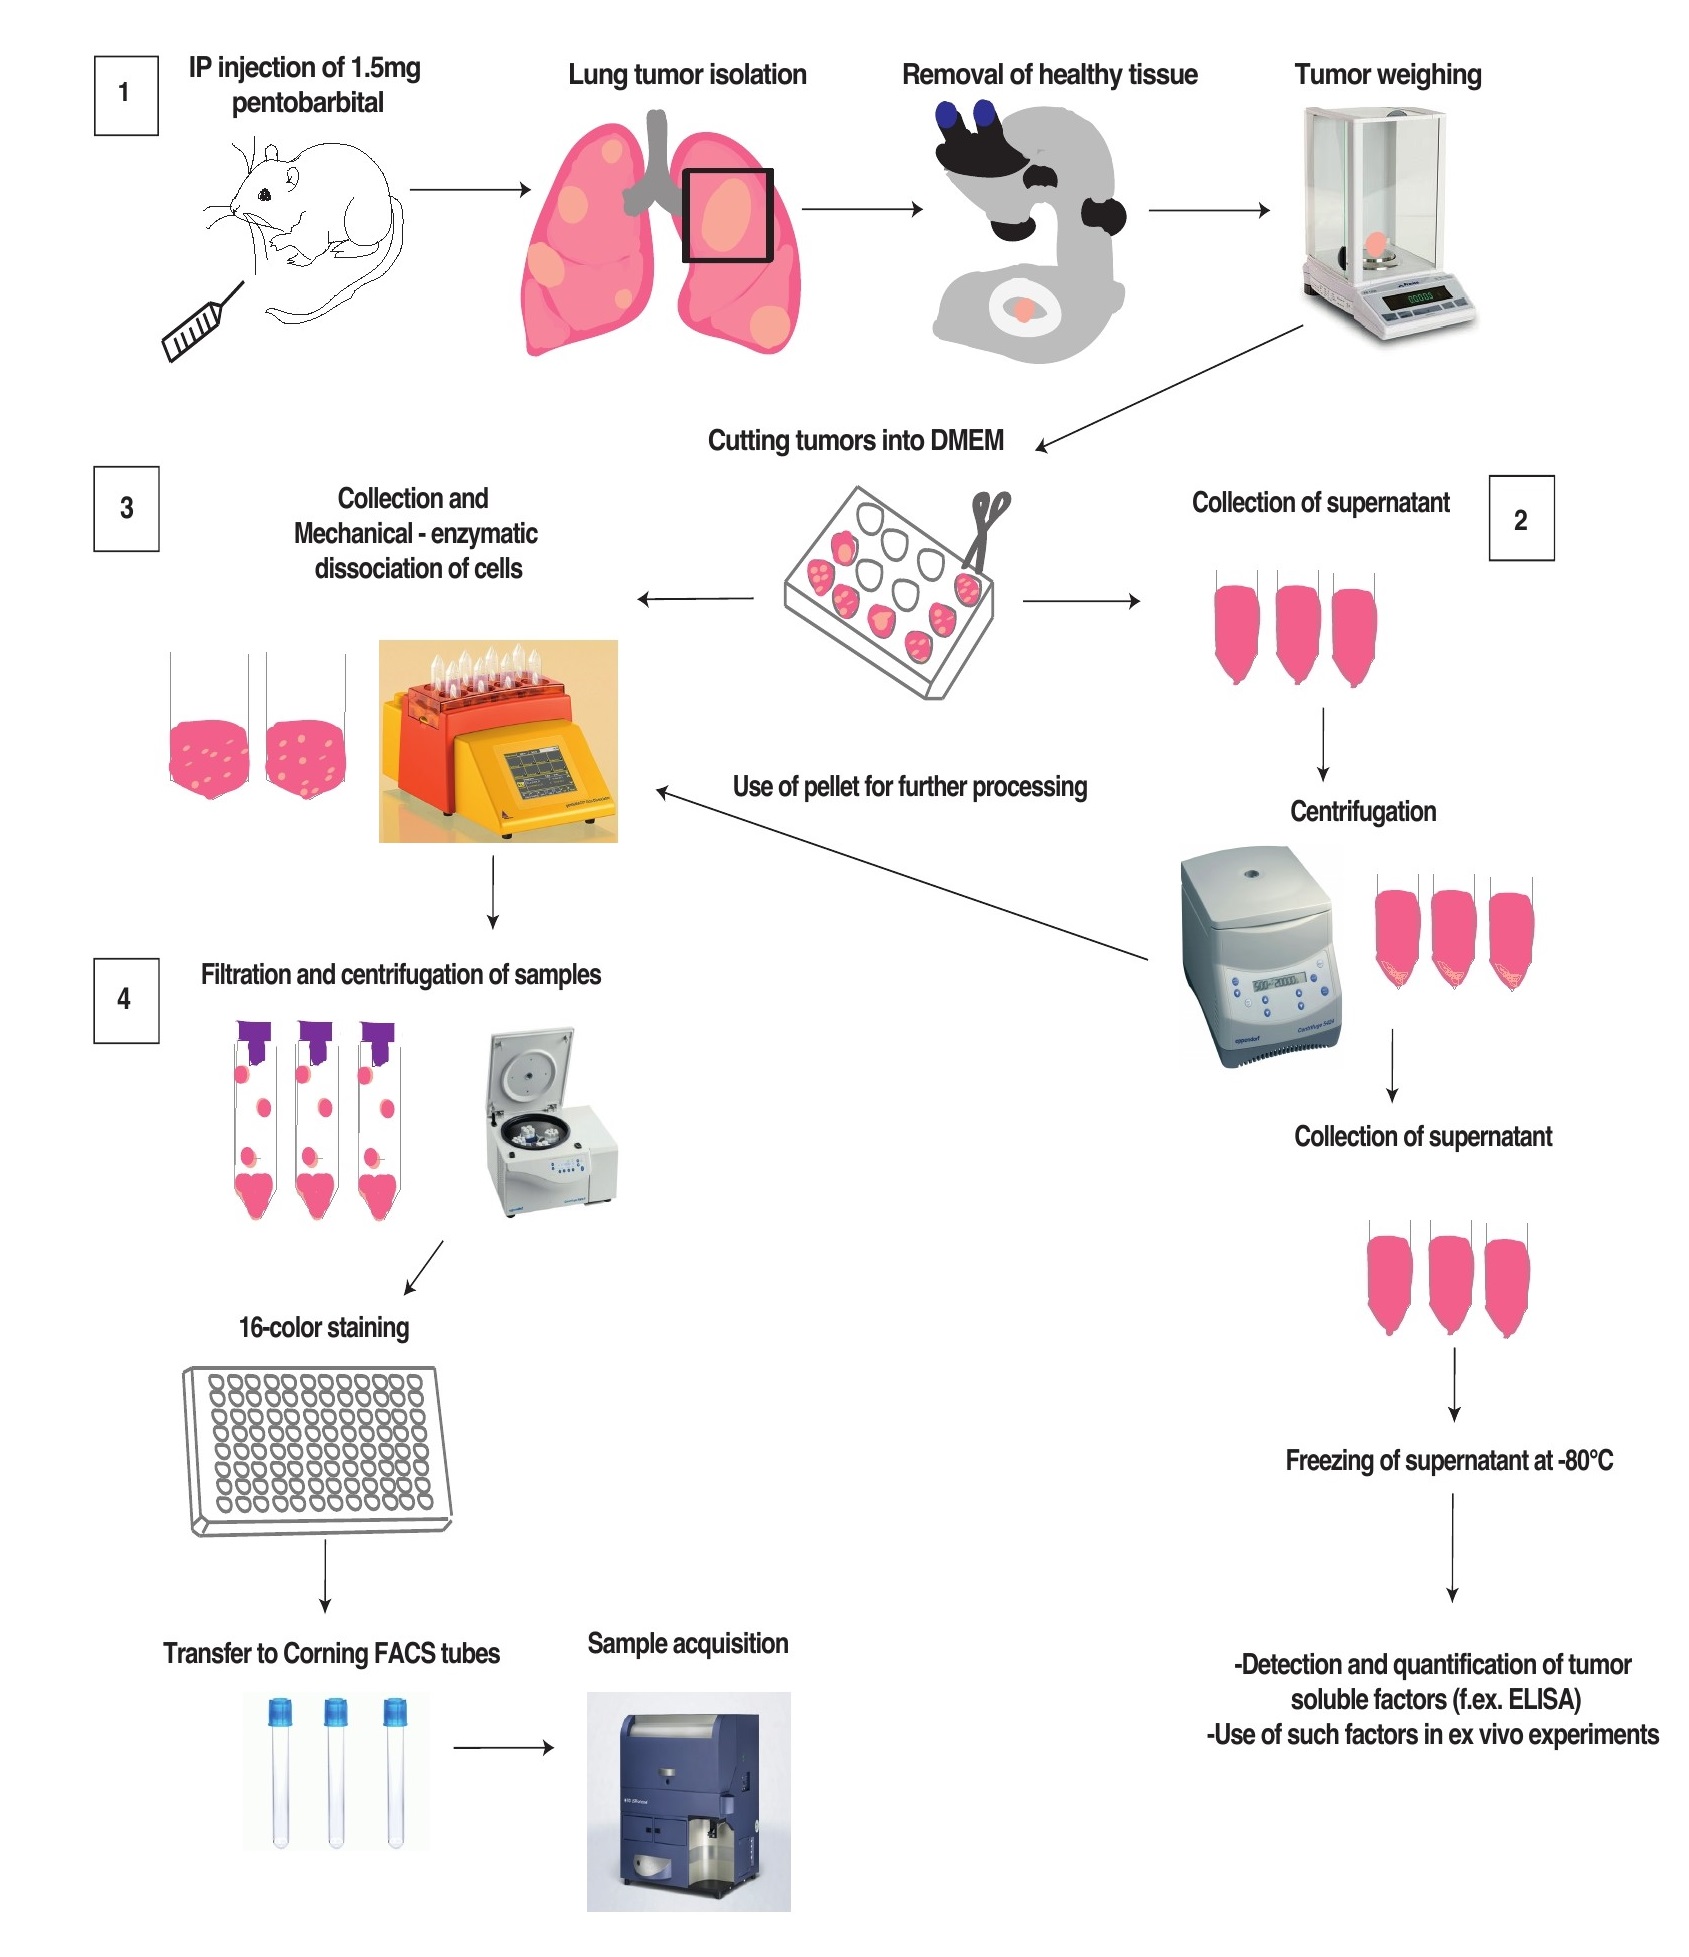
This protocol provides the methods to extract information on the infiltrating immune populations as well as on the soluble factors, found in the tumor microenvironment of the Cre inducible Kras G12D/wt p53 fl/fl mouse model of lung cancer (KP mice). In practice, individual tumors are isolated, weighed and chopped into a controlled volume of medium. The tumor soluble factors can then be collected from the supernatant. Further mechanical and enzymatic dissociation of these lesions followed by 16- color flow cytometry, allows the extraction of their immune signature.
METHODS
1.Necropsy
Sacrifice mice with intraperitoneal (IP) injection of 1.5mg pentobarbital. Avoid using asphyxia on animals displaying advance disease stages as it can cause lung hemorrhage dampening the quality of the results. Perform intra-cardiac terminal blood sampling, in order to minimize contamination with blood cells, and isolate the lungs. Select the biggest lesions and remove the surrounding parts of healthy tissue, under the stereoscope. This method works well on small (5mg) to very big (300mg) tumors. Then, weigh individual lesions and transfer them into wells of a 24-well plate and add 100μl of basal DMEM for 20mg of tissue. Chop the tumors into small pieces with the use of scissors.
2. Tumor soluble fraction
Collect the supernatant of each sample place it into a first eppendorf tube and centrifuge them for 5min at 380rcf. Harvest the liquid phase and transfer it into a new tube, centrifuge it again 10min 20,000rcf then filter into a 0.22μm filter and freeze it at -80 °C into a third tube. Re-suspend the cell pellet of the first tube in a small volume (100μl) and put it back in the corresponding well containing the cut pieces of tumors, for further processing.
3. Single cell suspension
In each well, add 2.5ml of digestion mix 1X containing 9.4mg/ml collagenase-I and 0.25g/ml DNase-I in DMEM Transfer each sample into gentleMACS tubes (Miltenyi Biotech, Ref: 130-096-334). Single-cell suspensions are obtained after the mechanical and enzymatic dissociation of tumors, performed with the gentleMACS octo Dissociator (Miltenyi Biotech).
4. Flow cytometry staining:
4.1 Add 5ml of basal DMEM to each sample then filter them using pre-separation filters 70μm (Miltenyi Biotech, Ref: 130-095-823) by transferring the 7.5ml of total volume per sample into a new 15ml falcon tube. Centrifuge them for 5min at 450rcf and re-suspend the pellet into 100μl of FACS buffer (0.5% EDTA and 2% FBS in PBS) per 20mg of tissue (weight determined in point 1). 100μl of cells are transferred into a 96-well plate and are used for FACS staining. For the controls, including the compensation and the Fluorescent Minus One (FMOs) controls, it is preferable to use a mix of cell suspensions originating from different samples. The controls will be useful to set the cytometer and to conduct the analysis of the flow cytometry data after acquisition.
4.2. Centrifuge the plate for 5min/450rcf and remove the supernatant. Then, stain the cells with 50μl of PBS containing (NO FCS in that step) 1:500 fixable cell viability dye (Live and Dead Blue life technology) and 1:100 Fc-blocking reagent. Incubate for 20min at 4°C and in parallel prepare the antibody mix in FACS buffer for the membrane staining. Consider using 50μl per well of antibody (abs) mix containing a 2x final concentration of the abs. Add 50μl of ab mix in each well (the concentration of the ab is then diluted by two as the plate already contains 50μl per well). Incubate the plate for 15min at 4°C and wash twice with FACS buffer.
4.3 At the end of the second wash, fix the cells with 50μl Foxp3 Transcription Factor Fix and Perm Buffer (Thermo fisher), incubate them for 20min at 4°C and wash twice with FACS buffer. The plate can be either filled with 200μl FACS buffer, covered with a plastic film and kept protected from light at 4°C for a week, or can be stained intracellularly (step 4.4) and acquired the same day.
4.4 Centrifuge the plate 5min/450rcf then remove supernatant, add 200μl of Perm buffer 1X and centrifuge for 5min/450rcf. Prepare 100μl of the antibody mixture for intra-nuclear/ intra-cytoplasmic staining in Perm buffer 1x, each ab being diluted at the final concentration. Remove supernatant and add 100μl of the ab-mix per well and incubate for 20min at 4°C. Then, add 100μl of Perm buffer per well, centrifuge the plate 5min/450rcf then repeat this step with 200μl of Perm buffer. Remove supernatant and do two washes with FACS buffer.
4.5 The cells are re-suspended into 150μl FACS buffer and transferred into Corning Falcon Test Tubes with Cell Strainer Snap Cap (Thermo Fisher Scientific, Ref:08-771-23). The LSRII SORP or Fortessa flow cytometers (Becton Dickinson) can be used for sample acquisition. Both instruments must be equipped with 5-lasers and 18-detector analyzers.
5. Analysis
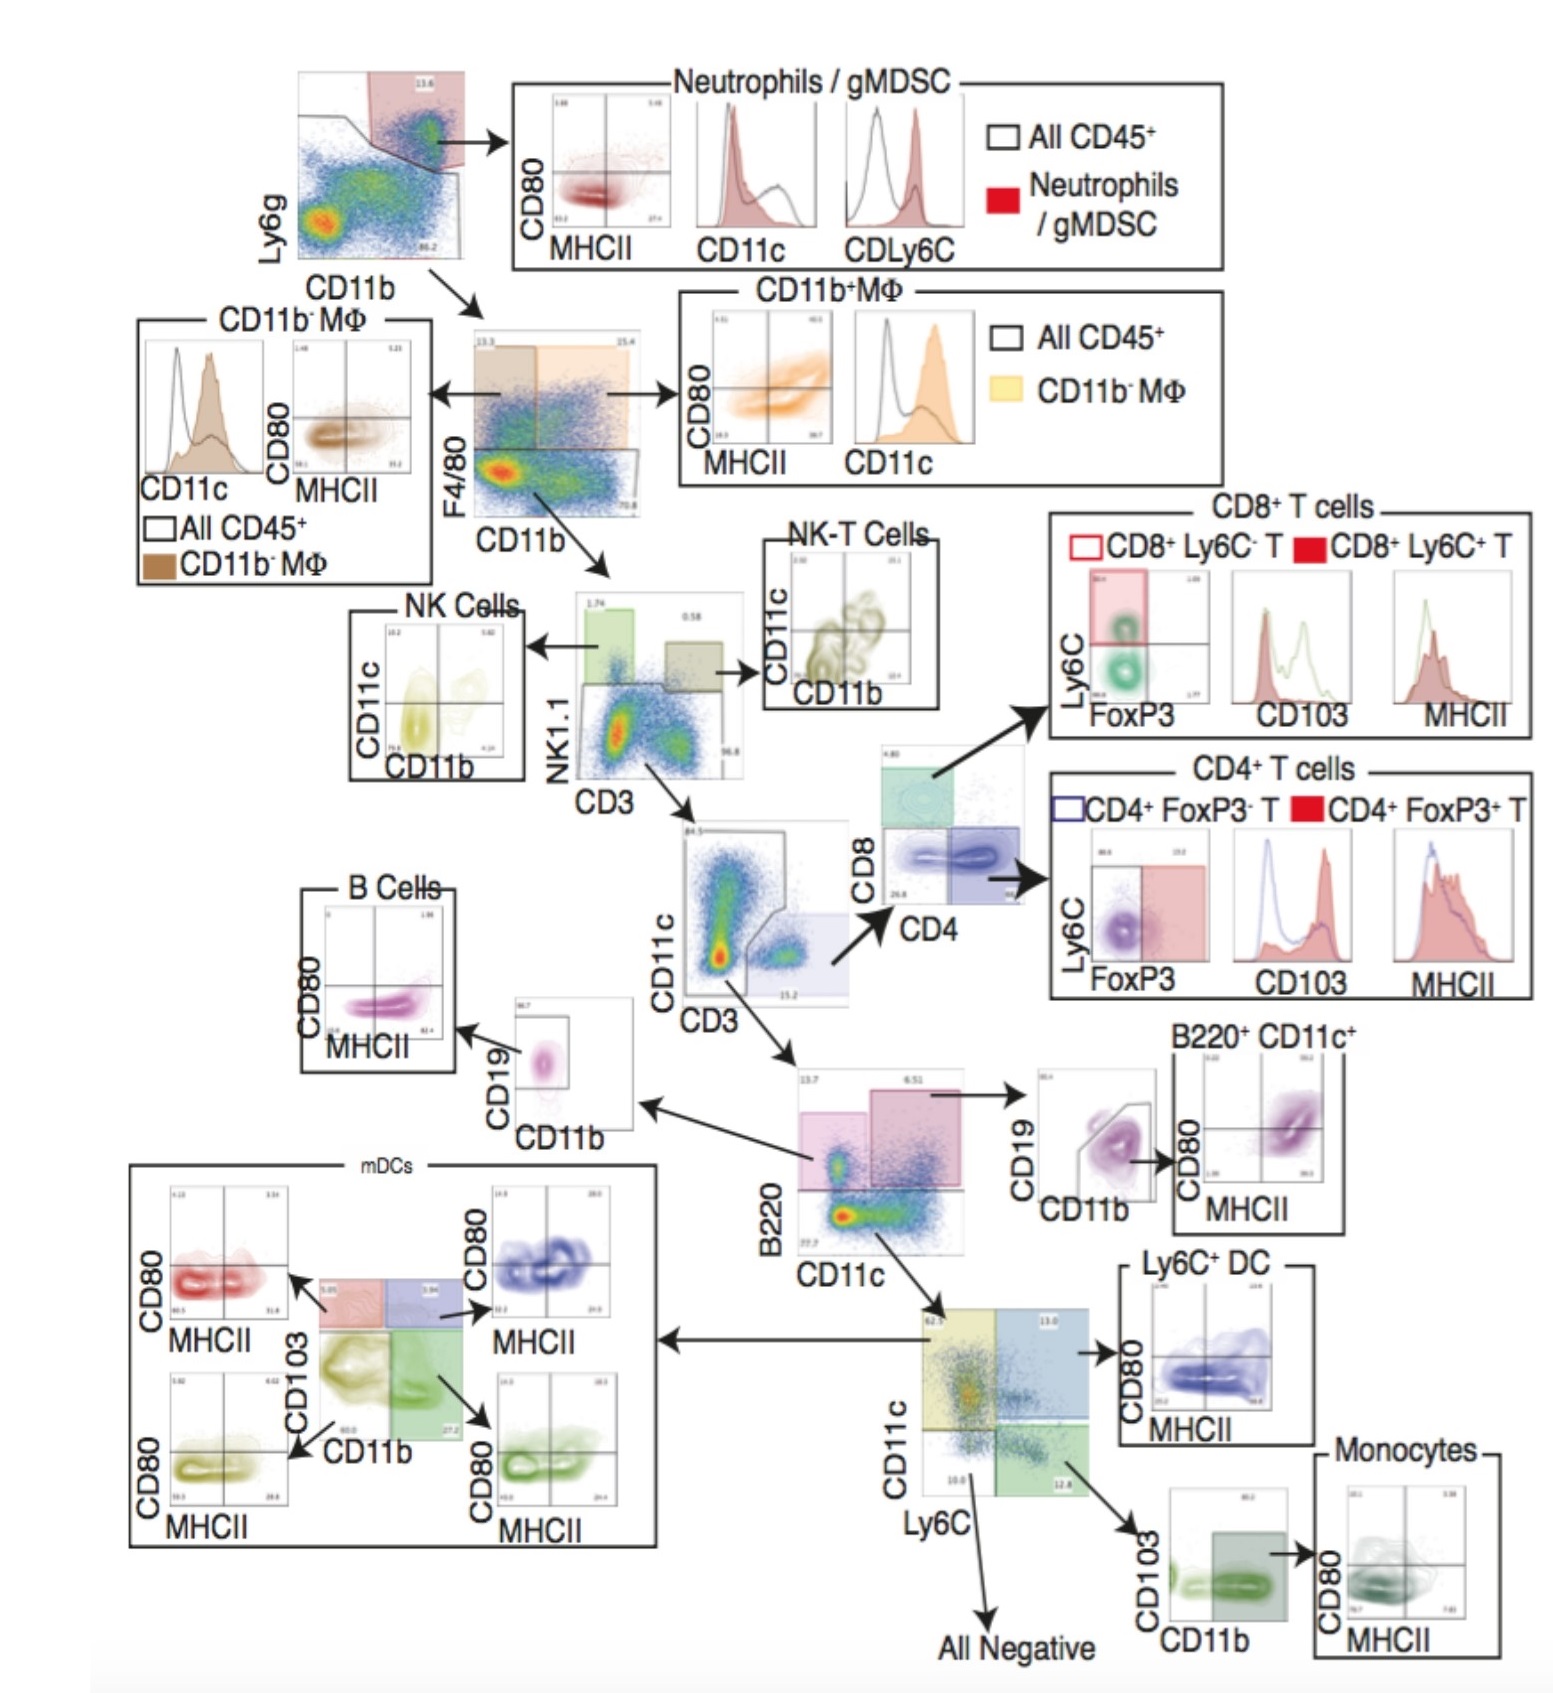
The example of the 16-color staining shows that multiple immune populations can be detected:
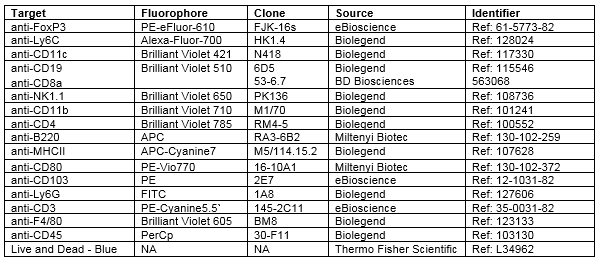
Leucocytes (CD45+), classical macrophages (CD11b+/intF4/80+), alveolar macrophages (CD11b–F4/80+) (only in lung), B-cells (B220+CD11b–), activated B-cells (MHCII+CD19+), T-cells (CD3+), CD4 T-cells (CD3+CD4+CD8–), CD8 T-cells (CD3+CD4–CD8+), regulatory T-cells (CD3+CD4+FoxP3+), neutrophils (Ly6CintLy6G+CD11b+), monocytes (Ly6C+CD11b+), dendritic cells (CD11c+Ly6C–), dendritic cells (DC) can be subdivided into four populations based on CD11b and CD103 expression and natural killer cells (NK1.1+CD11b–). For macrophages and DC, MHCII and CD80 expression define activated or resting cells.
5.1 Selecting the right method
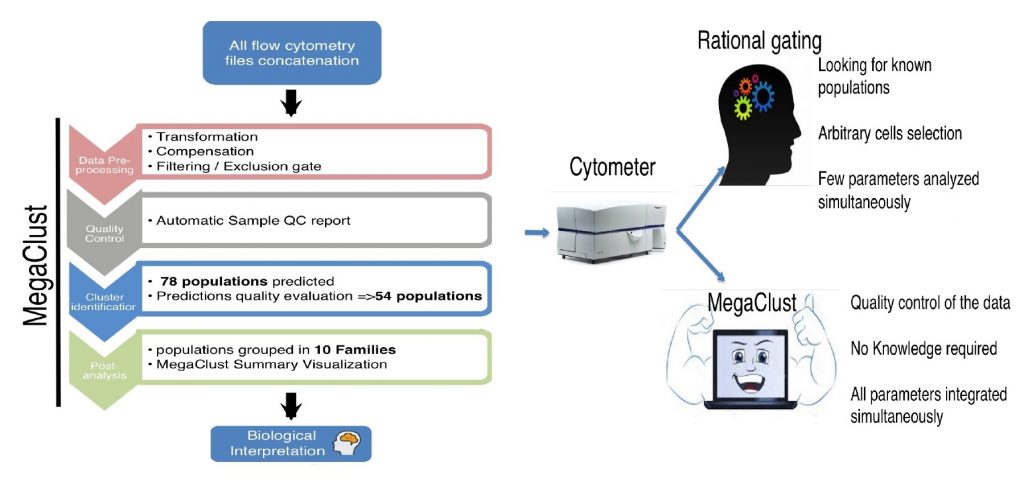
These complex flow cytometry data can be analyzed either on FlowJo X (FlowJo LLC ©) or on MegaClust Software https://megaclust.vital-it.ch/ (Julien Faget, Svenja Groeneveld et al, 2017). FlowJo allows rational gating strategy to identify known immune cells. On the other hand, MegaClust is designed to perform unsupervised analyses of such complex dataset. It offers both flow cytometry quality check and controlled immune population identification without dimensional reduction. This tool offers an interesting and non-redundant approach when compared to gold standard unsupervised methods (SPADE, ViSNE). For a trial contact EPFL Flow Core Facility sv.cytometry@epfl.ch .
5.2 Flow Jo based rational gating of 16 colors Flow cytometry data
5.3 Unsupervised Immune signature using MegaClust on 16 colors Flow cytometry data
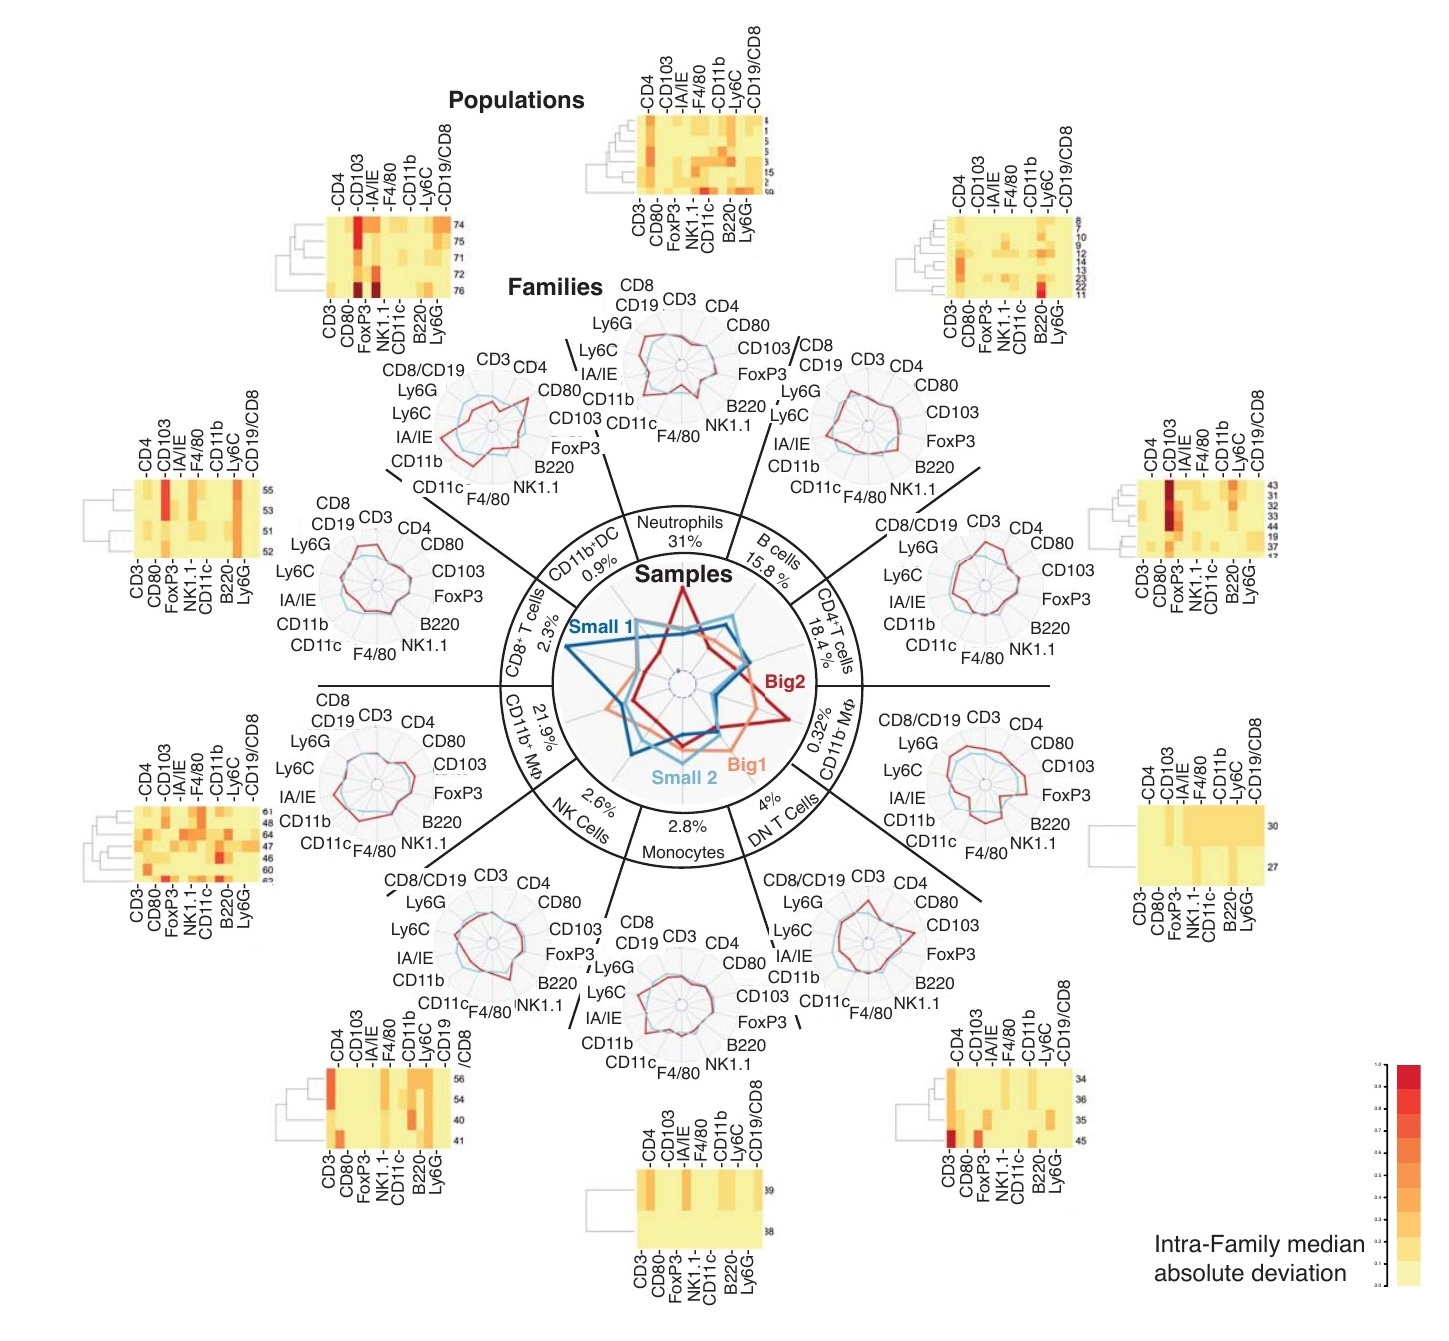
Dreamcatcher plot representing MegaClust results. Sample level: Central radar plot indicates the relative proportion of each immune cell family identified by MegaClust in Small1, Small2, Big1 and Big2 groups of samples. The average percentage of each family among all annotated immune cells across the 54 samples is indicated. Family level: Peripheral radar plots depict the relative expression of each marker by a specific family (red) compared to the average of all the immune cells (blue). The family names were attributed considering their expression of every marker. Population level: Heatmaps show individual cell populations within the families based on their deviation from the median expression of each marker across the whole family. White: population is close to the median expression of this marker across the family; red: high degree of deviation from the median marker expression across the family by a population.
REAGENTS:
|
Name |
Source |
Identifier |
|
Ethylendiaminetetraacetic acid (EDTA) |
Axon lab AG |
Ref: 205-358-3 |
|
Fetal Bovine Serum (FBS) |
Life Technologies |
Ref: 10270-106 |
|
Bovine Serum Albumin (BSA) |
Sigma aldrich |
Ref: A7906-100G |
|
DMEM |
Thermo Fisher Scientific |
Ref: 41-965-039 |
|
Fc-blocking Reagent |
Miltenyi Biotech |
Ref: 130-092-575 |
|
Foxp3 Transcription Factor Staining Buffer Set |
Thermo Fisher Scientific |
Ref: 00-5523-00 |
Tubes and filters:
|
Name |
Source |
Identifier |
|
gentleMACS tubes |
Miltenyi Biotech |
Ref: 130-096-334 |
|
Corning Falcon Test Tubes with Cell Strainer Snap Cap |
Thermo Fisher Scientific |
Ref: 08-771-23 |
|
pre-separation filters 70μm |
Miltenyi Biotech |
Ref: 130-095-823 |
Instruments:
|
Name |
Source |
|
gentleMACS octo Dissociator |
Miltenyi Biotec |
|
LSRII SORP |
Becton Dickinson |
|
LSR Fortessa |
Becton Dickinson |
Validated panel:
16-color staining
REFERENCE:
Julien Faget, Svenja Groeneveld, Gael Boivin, Martial Sankar, Nadine Zangger, Miguel Garcia, Nicolas Guex, Inti Zlobec, Loic Steiner, Alessandra Piersigilli Steiner, Ioannis Xenarios, and Etienne Meylan , Neutrophils and Snail Orchestrate the Establishment of a Pro-tumor Microenvironment in Lung Cancer, Cell Reports, 2017
